It’s all in the numbers as they say, and the numbers can be quite telling from an HR perspective, allowing VP’s and Directors of HR to quickly gauge what I call the “HR Health” of their organization.
Many of today’s HR solutions offer you the ability to create dashboards that contain your most important workforce metrics, so that you can quickly spot trends, set strategy and remain competitive in the marketplace. With the move to cloud-based HR systems, the trend towards full HR solutions and “big data” being collected, it is far easier today to visualize the HR Health of your organization with the right tools.
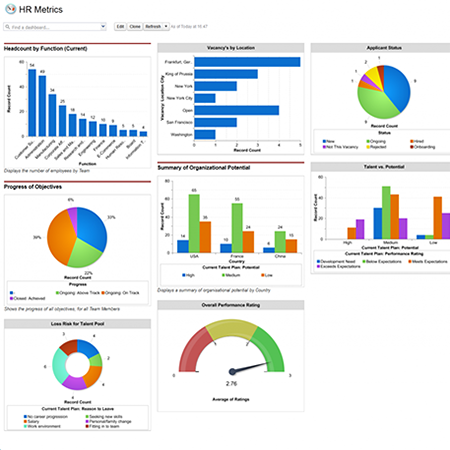
Traditionally, HR has focused on individual metrics, like total headcount, or turnover, and usually in report format. Think about how powerful, and insightful it would be to have a Dashboard containing multiple metrics, on a single page, always in front of you. Financial people look at stock prices and sales continually. Why not HR? The technology and data are available today to help HR professionals continually monitor the lifeblood of their company – its people. A sample HR Metrics dashboard is shown below.
What kinds of metrics would be leading indicators of HR Health – and be important to have on your dashboard? Some of these metrics might include:
- Headcount by function
- Vacancy by location
- Employee turnover (overall company, by department and manager)
- Employee turnover for company vs. typical industry average
- Employee satisfaction (assess whether its high, medium or low morale)
- Progress of objectives
- Employee loss risk
- Top reasons that employees leave
- Voluntary and Involuntary separation percentages
- Dollars invested annually in training and development
- Talent vs potential
- Hiring/Recruiting expenses
- Quality of new hires (% still on staff after 180 days)
- Overall performance rating
- Time to fill open positions
- On-boarding Process (costs and time spent)
- New hire sourcing & costs
- Average tenure (by department)
- Wage rates/scales compared to industry averages
- Is the organization top-heavy? (% with management titles)
- Percentage of employees that participate in your 401k program
Looking at some or all of these metrics would provide a more complete picture of your HR Health and help you determine if new strategies or initiatives are needed.
Why is monitoring HR Health so important? Looking at these factors is critical because the majority of a company’s expenses are tied to people — salaries, cost of benefits, recruiting costs, skills and knowledge development. Company success is directly linked to these items.
Start Simple! Begin with some basic data points, and then add more complex metrics later. The main point is to use the technology to better manage your workforce and gauge your HR Health. You’ll have real-time data that can be used to drive your HR strategy, new policies and actions. In 2014, let’s set a goal to create and continually monitor these dashboards.
To Your HR Health!


